Devops
How to Self-Host Nginx Ignition Locally Using Docker Compose and PostgreSQL
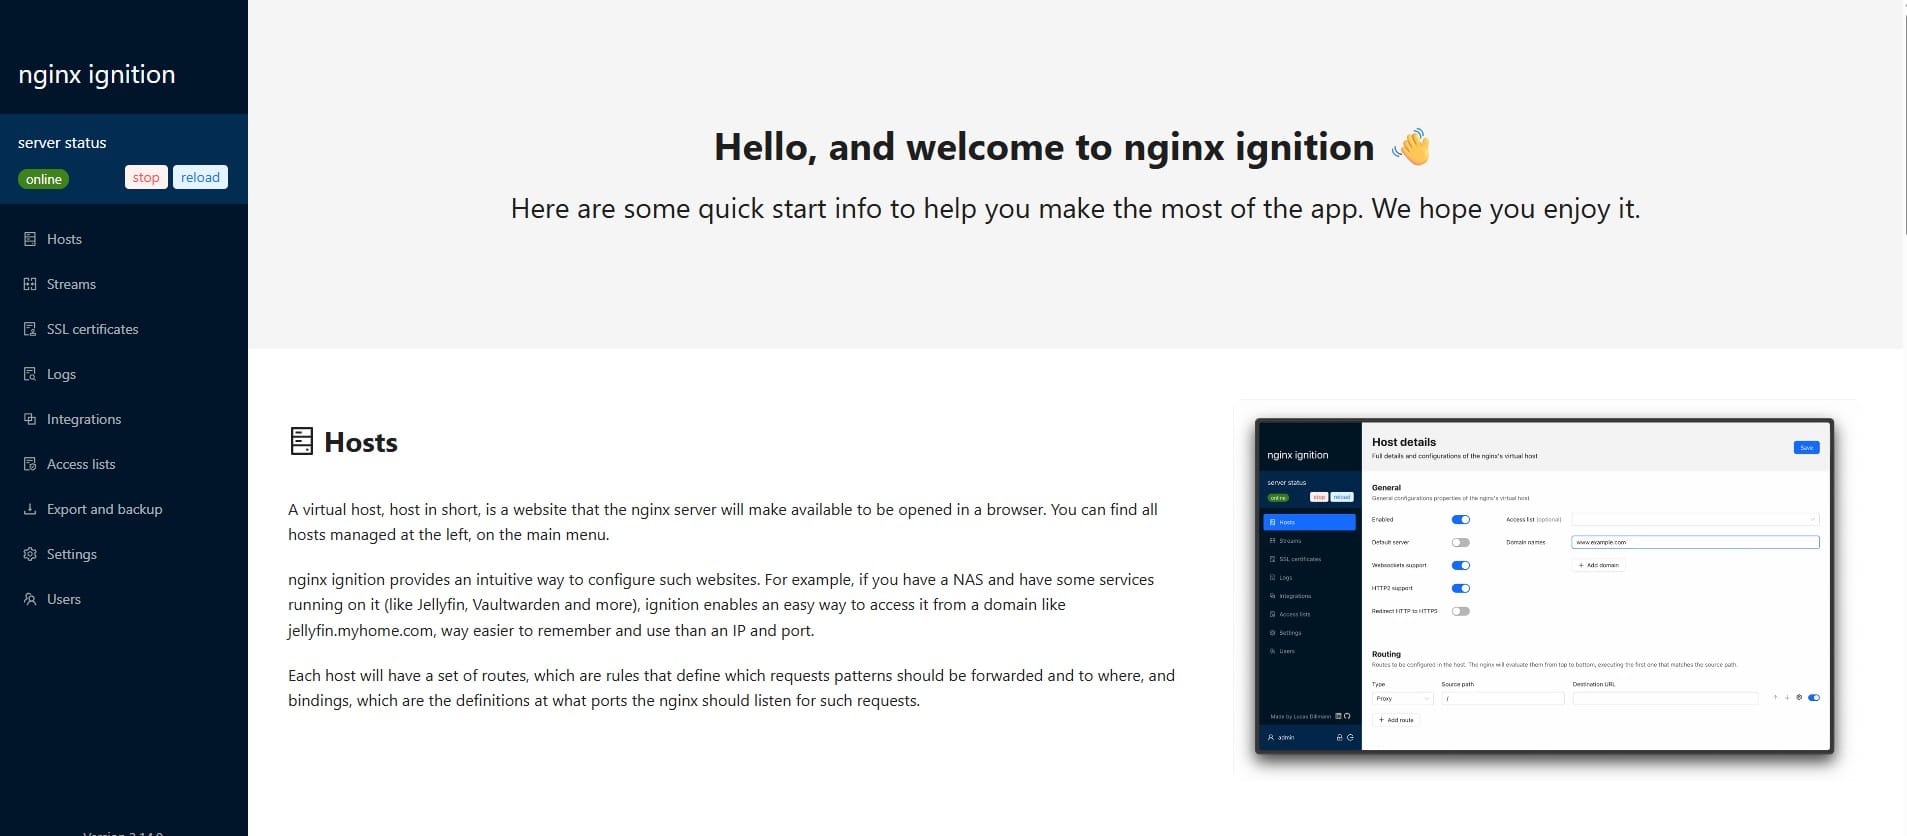
What is Nginx Ignition? Nginx Ignition is an user interface for the nginx web server, aimed at developers and enthusiasts that don't want to manage configuration files manually Today, I’ll walk you through the steps to self-host Nginx Ignition on your local machine using Docker Compose and